- Research
- Open access
- Published:
Prediction of blood culture outcome using hybrid neural network model based on electronic health records
BMC Medical Informatics and Decision Making volume 20, Article number: 121 (2020)
Abstract
Background
Blood cultures are often performed to detect patients who has a serious illness without infections and patients with bloodstream infections. Early positive blood culture prediction is important, as bloodstream infections may cause inflammation of the body, even organ failure or death. However, existing work mainly adopts statistical models with laboratory indicators, and fails to make full use of textual description information from EHRs.
Methods
We study the problem of positive blood culture prediction by using neural network model. Specifically, we first construct dataset from raw EHRs. Then we propose a hybrid neural network which incorporates attention based Bi-directional Long Short-Term Memory and Autoencoder networks to fully capture the information in EHRs.
Results
In order to evaluate the proposed method, we constructe a dataset which consists of totally 5963 patients who had one or more blood cultures tests during hospitalization. Experimental results show that the proposed neural model gets 91.23% F-measure for this task.
Conclusions
The comparison results of different models demonstrated the effectiveness of our model. The proposed model outperformed traditional statistical models.
Background
With the rapid development of computing technologies, more and more medical monitoring equipments and software systems are used in clinical practice, generating a large amount of data. This provides opportunities and challenges to accelerate clinical science using large scale of practical clinical data in less expense [1, 2]. For this reason, machine learning has been increasing impact for medical information research. Various machine learning techniques have been used to mine clinical knowledge [3–7]. Earlier work demonstrated the feasibility of building predictive models with clinical data [8, 9]. Ideally, we wish to be able to establish such models from data routinely collected in Electronic Health Records (EHRs) [10]. In the present research, our aim is to construct a novel model for predicting the risk of bloodstream infection of patients during hospitalization by predicting positive Blood Cultures (BCs).
The positive BCs is defined as a blood sample in which bacteria or fungi are present. The growth of bacterial or fungi in the blood can cause inflammation of the body, even organ failure or death [11]. When test positive is suspected blood is drawn for blood culture and the patient is started on antibiotics. On average for every culture-positive results an additional more patients receive antibiotic treatment contributing to antibiotic resistance in the community and increased healthcare costs [12]. Rapid identification of positive BCs is important for the rapid initiation of optimal treatment in patient. When BCs results are not available, the decision to continue or stop antibiotics is made based on laboratory test and the clinical profile of the patient. However patients’ clinical descriptions are complex unstructured texts and not fully understood [13, 14].
In recent years, some researchers have noticed the importance of these problems [15, 16]. Matheny et al. [17] developed a hybrid rules and natural language processing methods for detection of blood culture bacterial contamination. Steenkiste et al. [18] proposed a temporal computational model to explore for the potential prediction of the outcome of a blood culture test based on nine clinical parameters measured over time. However, this model only uses the numerical physical indicators.
Motivated by these observation, we propose a novel hybrid neural network model which could extract the laboratory and the clinical description features simultaneously, for predicting positive blood culture based on EHRs. Electronic Health records usually contain two main information: textual description and discrete laboratory physical indicators. A piece of EHRs are shown in Fig. 1. We can see a patient’s Chief Complaints (CC), Admissions Records (AR), physical and laboratory indicators. The main contributions of the proposed method can be summaried as follows:
-
In the study, we construct a dataset from a large amount of raw EHRs which contained one or more blood culture tests taken during hospitalization.
Fig. 1 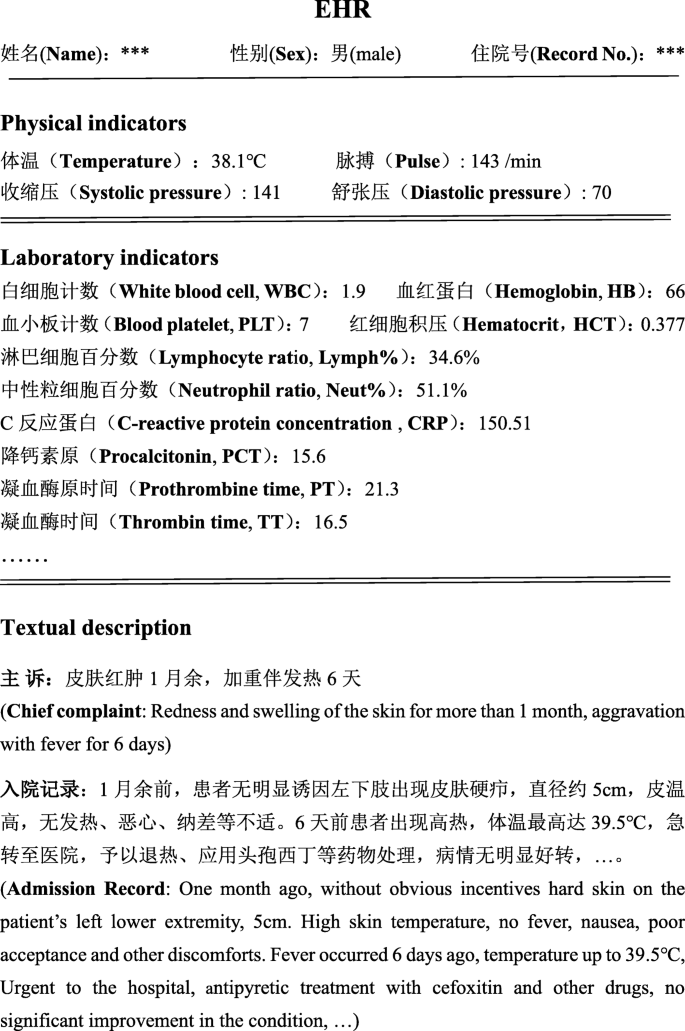
A piece of EHRs from a patient
-
The hybrid model incorporates Attention-based Bi-directional Long Short Term Memory (ABiLSTM) and Denoising Autoencoder (DAE) network. The ABiLSTM is used to extract textual features and DAE takes the numerical indicators as input for capturing important numerical features.
-
Conduct an extensive and large-scale empirical study to evaluate the effectiveness of the our method.

Related work
There are a number of studies that use machine learning techniques in the field of disease prediction [19, 20]. The majority of these works focused on the numerical factors including physical examination factors and laboratory indicators. For example, Zou et al. [21] used decision tree, random forest and neural network to predict diabetes mellitus based on 14 clinical attributes. Ding et al. [22] applied a random forest model for predicting acute respiratory distress syndrome events in ICU patients based on 42 clinical variables. Yin et al. [23] used preprocedural clinical variables to develop a model for prediction of contrast-induced nephropathy (CIN) before radiological procedures among patients administered contrast media.
Moreover, some researches have conducted to the early detection of bloodstream infecions by predicting the outcome of blood cultures [18, 24]. Mani et al. [25] developed non-invasive predictive models for late onset neonatal sepsis based on the electronic medical records. A blood culture was taken to further differentiate between negative and positive culture sepsis. Instead of exclusively looking at physiological features, Lukaszewski et al. [26] trained an artificial neural network model to predict positive BCs. This model could correctly predict the outcome of the blood culture test in 83.09% of patient case. However, this research was performed based a limited data set of only 92 patients.
Previous researches mainly uses clinical laboratory parameters to predict diseases without directly taking into account unstructureal clinical description from the EHRs. Here, we present a hybrid neural network model which could extract the laboratory and the clinical description features simultaneously from EHRs to predict the outcome of blood cultures. The models may contribute to the discontinuation of antibiotics in negative cases before BCs results become available. The end results could be reduced antibiotic use with its associated benefits for the patient and for healthcare utilization. To this end, we explore and illustrate the potential of neural networks in the accurate prediction of positive blood cultures.
Methods
Task modeling
When doctors suspect a patient to test positive they can decide to advance to a blood culture test, the task aims to construct a model to predict positive blood culture results. We model the prediction task based on the following steps.
-
We construct a dataset D∗ from the real EHRs dataset. Specifically, positive examples indicate that patients have positive blood culture results at least once during hospitalization, which is denoted as D+∈D∗. Negative examples indicate that the result of patient’s blood culture were all negative, which is denoted as D−∈D∗.
-
At the training phase, we use the data D∗ that contains both D+ and D− to train our model M.
-
At the test phase, we apply the well-trained model M to predict patient’s blood culture test result, which can distinguish patients who has a serious illness without infections or patients with bloodstream infections.
Hybrid neural network model
Our proposed hybrid neural network model including two main parts: attention-based BiLSTM and Autoencoder, the whole architecture of our method can be found in Fig. 2. ABiLSTM is used for learning continuous representation from the textual description information. The textual information contain the patient’s chief complaints and admissions records in EHRs. Chief complaints refer to patient’s symptoms and feeling of abnormal physiological function when the patient is ill. The admissions records are the text description of patient’s present illness at admission. Plenty of useful information is embedded in clinical text, which are critical for disease analysis [27, 28]. In addition, the Autoencoder is used to learn continuous representation from the laboratory biochemical indicators in EHRs.

The proposed hybrid neural network framework
Textual representation
In this study, the input from textual sentences describe the basic disease symptoms and which may imply useful information behind the texts. Chinese clinical texts are dramatically different from clinical texts in English, as there is no separator between words. At present, many words segment tools are be proposed for Chinese text analysis such as THULAC (https://github.com/thunlp/THULAC-Python), Jieba (https://pypi.org/project/jieba/). However, there are no special Chinese word segmentation tools for the clinical domain. In this study, Chinese clinical sentences are segmented into single Chinese characters. ( were segmented into
Formally, given an input sentence \(x =x_{1},\dots,x_{n}\), the BiLSTM model first finds the word or phrase embedding e(xi)∈RL of each word xi in the lookup table E∈RL×V, where L is the dimension of embedding vector and V represents the vocabulary size.
BiLSTM models a recurrent state transform sequence from an input sequence to a hidden state sequence. Basically, a LSTM represents each time step with an input, a memory and an output gate, denoted as it,ft,ot, respectively.
where λ is the element-wise sigmoid function and ⊙ is the element-wise product. xt is the input vector (word embedding) at the time t, and ht is the hidden state vector, W are weight matrices, and b are biases.
The BiLSTM has two parallel layers in both forward and backward direction. Therefore, we get a sequence \(h_{ft}=\left \{\overrightarrow {h_{1}},\dots,\overrightarrow {h_{n}}\right \}\) from left to right, and another sequence \(h_{bt}=\left \{\overleftarrow {h_{1}},\dots,\overleftarrow {h_{n}}\right \}\) from right to left. We then concatenate these two hidden outputs as one total output:
Based on the BiLSTM modeling, we obtain textual representation ht.
Attention mechanism has been demonstrated success in machine learning. In this section, we use the words attention to enhance performance of the disease prediction. In EHRs, not all words or phrases are equally important for predicting positive blood culture, under the assumption that the label of xt is not determined by ht only. Let h be a matrix consisting of output vectors \([h_{1},\dots,h_{n}]\) that the BiLSTM layer producted, where n is the sentence length. The attention layer produces a new representation sequence \(h^{(r)}=\left (h^{(r)}_{1},\dots,h^{(r)}_{n}\right)\), where \(h^{(r)}_{t}\) is the representation at step t and can be calculated as follows:
where tanh is the activation function, αt is the weight vector for each word in the sentence calculated as follows:
where softmax is the normalization function, \(h\in \mathbb {R}^{d^{w} \times T}, d^{w}\) is the dimension of word vectors, w is a trained parameter vector. Finally, the attention layer produces a new representation sequence \(h^{(r)}=\left (h^{(r)}_{1},\dots,h^{(r)}_{n}\right)\).
Numerical representation
The laboratory biochemical indicators are all the numerical features in our clinical data, and some of the values are correlated. Using these values directly are not applicable. Previous work showed that the Denoising Autoencoder (DAE) network can be exploited for noise and correlation reduction, feature extraction [29, 30]. Therefore, we employ DAE to extract the numerical features.
DAE is a machine learning model that aims to reconstruct input data as close as possible. A DAE generally comprises two parts: encoder and decoder. The initial input x is corrupted to \(\tilde x\) by a stochastic mapping \(\tilde x \sim q\left (\tilde x |x\right)\). Then the encoder maps an input \(\tilde x\) to a hidden representation h(z) via a nonlinear transformation.
And then the decoder maps the hidden representation h(z) back to reconstruct data \(\tilde x\) via another nonlinear transformation:
Where W and b represent the weight and bias matrices of encoder, respectively, while \(\hat W\) and \(\hat b\) represent the weight and bias matrices of decoder, respectively. Moreover, f() and g() denote non-linear activation functions, such as the sigmoid function, hyperbolic tangent, and rectified linear function. Finally, we obtain a refined representation h(d) of the discrete values.
Out layer
A fully connected layer is used to combine two types of vectors from textual representation and numerical representation. This layer can be computed as:
where W(A) is a parameter, and g is ReLU function. Here, the dropout technique is utilized to avoid the overfitting. Finally, we employ the softmax activation function as the classifier in the bottom of the fully connected layer to obtain the output.
Experiments
Dataset construction and data preprocessing
To construct the dataset of this task, we gather a large amount of EHRs data, which is from the first affiliated hospital of Zhengzhou University, with a span of 2 years ranging from 2017 to 2018. The raw EHRs contain some personal privacy, e.g., patient’s name, hospitalization number, resident ID number etc., so we remove these information by preprocessing. In addition, all patients were at least 16 years old at the moment of admission. We selected patients who had at least one blood culture test taken during hospitalization as our goal to construct a model which can distinguish patients who has a serious illness without infections and patients with bloodstream infections. We defined two patients groups. One group consisted of patients who had positive blood culture result at least once after their admission in the hospitalization. And in another group, the results of the blood cultures tests are all negative during hospitalization. The goal of this research is to predict the risk of bloodstream infection of patients during the hospitalization by predicting positive blood cultures. We did not distinguish the pathogen types. As such, we cannot rule out that positive blood cultures, which may be the result of false positive predictions caused by skin contaminants. Finally, we select a set of patients from the EHRs based on the following criteria:
-
A patient who had blood culture positive results during hospitalization is selected as positive example.
-
A patient whose results of all blood culture tests are negative during hospitalization is selected as negative example.
Based on the above steps, we get total 28043 patients, in which 25056 patients are negative examples and 2987 patients are positive examples. This is an extremely imbalance dataset, and is problematic for directly conducting the experiments. To tackle this problem, we employ undersampling method to balance the classes. Specifically, we randomly deletes the majority-class data for balancing the dataset. At last, there are total 5963 examples in the dataset after undersampling. For the purpose of fully utilizing these dataset, we repeated the random undersampling for ten times to get the average prediction results.
The extracted data consists of textual description and numerical indicators in EHRs. The textual information contain the patient’s CC and AR in EHRs, which includes the patient’s disease symptoms and test results. These information is important and closely related to the patient’s health. In addition, we extract the laboratory numerical parameters in EHRs. First, we removed clinical parameters which present in a small fraction of patients. The remaining parameters were further grouped in 27 parameter features as illustrated in Table 1, including three basic features (sex, age and temperature) and twenty-four blood test indexes. After removals of missing data, we further normalize the data:
where x is the value, avg the average of all values and std the standard deviation.
The textual and basic features were extracted from admissions records after admission. Normally, patients may have multiple blood tests during hospitalization, but in this study we only analyzed blood test indexes before the first positive blood culture test. For the positive group of patients, we extracted the test results before the first blood culture test was positive, including the maximum PCT and CRP values and the seven terms of coagulation test results with the maximum PT value. Besides, we also extracted the latest 15 blood test indexes before the first positive blood culture. For the negative group of patients, we extracted the minimum PCT and CRP values during hospitalization. The latest another 25 clinical indexes were extracted before the first blood culture test.
In summary, we obtain one dataset across 5963 patients with each one containing 27 clinical features. A patient was labeled as ‘1’ with a positive blood culture and ‘0’ otherwise.
Evaluation metric
In our study, we use widely-used evaluation measures to evaluate the performance of prediction models, including precise, recall and F-measure. These measures can be defined by True Positives (TP), False Positives (FP), False Negatives (FN) and True Negatives (TN) in Table 2. Here TP, FN, FP and TN are the number of examples correctly labeled as positive, the number of positive examples incorrectly labeled as negative, the number of negative incorrectly labeled as positive, the number of negative examples correctly labeled as negative, respectively.
The recall rate denotes the ratio of the number of positive examples that are correctly classified as positive to the total number of positive examples. This measure is very important for our task, because prediction models intend to find out positive examples as much as possible. The precision of a model denotes the ratio of the number of positive examples that are correctly classified as positive to the number of examples that are classified as positive. The prediction precision evaluates the correct degree of prediction model, which are defined as :
Obviously, a good prediction model desires to get high value of recall rate and precision. However, there exists trade-off between the recall rate and precision. Therefore, a comprehensive measure of recall rate and precision is necessary. F-measure is the harmonic mean of recall rate and precision, which is defined as:
where α∈(0,+∞), is the weight of recall metric. In this research, we use α=1.
All the above evaluation measures range from 0 to 1. Obviously, an ideal prediction model should hold high values of recall rate and F-measure. In the experiment, we evaluate the performances of models in terms of recall and F-measure. We also get the precision results since it has been included in the comprehensive F-measure.
Experimental settings
For datasets, we performed 10-fold cross-validation following prior work [31]. The whole dataset is split into ten sections, each decoded by the model trained from the remaining nine sections. We randomly choose one section from the nine training sections as the validation dataset to tune the model parameters.
In our experiments, there are two types of parameters, containing model hyper-parameters and other setting. Typically, L denotes the dimension of the word vectors, Lbilstm is the maximum length of the input textual sequences, NAE is the number of Autoencoder layer, NMLP is the number of fully connected layers. The dropout rate in fully connected layer is denoted as Rdropoout. λ is the initial learning rate for AdamGrad. In our model, the word embedding E, is randomly initialized with uniform samples from \([-\sqrt {\frac {6}{r+c}},+\sqrt {\frac {6}{r+c}}]\), where r and c are the number of rows and columns in the structure. Parameters are shown in Table 3.
To validate the effectiveness of the proposed approach for prediction of blood culture outcome, we compared our approach with the several representative methods, four discrete models including Logistic Regression (LR), Naive Bayes (NB), Support Vector Machine (SVM) and Adaboost Decision Tree (ADT). These discrete models have been extensively used for classification tasks, giving competitive results. And three neural models: Convolutional Neural Network (CNN), Bi-directional Long Short Term Memory (BiLSTM) and a hybrid neural network models which integrates the Autoencoder (AE) with the ABiLSTM to make use of two types of features. And all above baseline models are implemented with Sklearn and Tensorflow.
We design three experiments to evaluate our approach: (1) Only laboratory biochemical indicators as input to the model (Numerical input only, noted as Numerical). (2) Only the textual features such as patient’s information, symptoms and admissions records in the EHRs as input to the model (noted as Textual). (3) Numerical and textual features as input to the model.
Results
In this section, we evaluate the performance of our hybrid model based on the ability to accurately predict the outcome of a blood culture test. Firstly, we compare the ability of the different methods to predict positive blood culture based on the laboratory features. Based on the constructed dataset, Table 4 shows experimental results of different methods. We can know that the LR model proposed by Chen [32] only gives 78.91% F-measure. The main reason is that this model only take laboratory indicators as input, ignoring the textual description information from EHRs. This limits the performance of the task. The NB and SVM models gives 81.95% and 83.23% F-measure, outperforming the LR model. This shows the effectiveness of these two models in this task. Among all models, ADT gives the relatively highest results, giving 85.56% F-measure. The main reason is that ADT is a boosting model which contains multiple meta classifiers and uses the assembling mechanism, and this makes ADT model more powerful.
Table 5 shows the experimental results of different methods based on textual description information from EHRs. Among all models, the neural network models get the relatively good results. The BiLSTM gives 72.59% F-measure and the ABiLSTM could get 73.21%. This demonstrates that the neural network has powerful ability to fully learn the intrinsic features from the textual description. However, we can easily observe that using only textual information, no better than laboratory indicators features.
The experimental results of different methods based on laboratory+textual features are shown in Table 6. By integrating DAE, ABiLSTM+DAE could achieve 91.23% F-measure on laboratory+textual features, which is significantly higher than other methods. Remarkably, we can know that all models can get better performance based on the combination of numerical and textual features compared to the only laboratory (numerical) and textual features. This is because different types of features in EHRs can both give their own contributions. Meanwhile, the results from only laboratory features are better than that from numerical features.
Discussion
In this section, we analyze the results on constructed test set to show the main reasons that the hybrid model (ABiLSTM+DAE) is better than the discrete models (ADT). We characterize the main errors generated by the hybrid model. Table 7 shows the number of positive examples for correct/incorrect recognition. For positive blood culture prediction, the number of examples that were addressed correctly by ABiLSTM+DAE model but incorrectly by the ADT model is over 3.5 times compared to those addressed by the ADT model correctly but by the ABiLSTM+DAE model incorrectly (345 versus 97). Moreover, among the 345 examples that were addressed correctly ABiLSTM+DAE model but incorrectly by the ADT model. This indicates that the hybrid model helps to capture more features information to improve prediction performance.
Conclusion
It is challenging to predict patients at risk for bloodstream infection based on laboratory test results and the clinical profile of the patient. Therefore, the ability to accurately predict a positive outcome of blood cultures at an early stage may save lives and make full use of medical resources. In this paper, we propose a hybrid neural networks model by integrating the attention based BiLSTM and denoising Autoencoder networks to predict the outcome of a blood cultures. Based on the constructed dataset from the raw Chinese EHRs, experimental results show that this model can accurately determine the outcome of blood culture test at the moment the blood sample was taken. In this study, we only used the contents of chief complaints and admissions records in EHRs and did not integrate all contents of EHRs into the model, such as medical orders, surgical records, nursing records and so on. Therefore, future research will focus on how to integrate different types of medical information to improve the prediction effect for positive blood culture.
Availability of data and materials
The experimental data will not be shared as it involved in privacy conditions.
Abbreviations
- EHRs:
-
Electronic Health Records
- BCs:
-
Blood Cultures
- CC:
-
Chief Complaints
- AR:
-
Admissions Records
- ABiLSTM:
-
Attention-based Bi-directional Long Short Term Memory
- DAE:
-
Denoising Autoencoder
- TP:
-
True Positives
- FP:
-
False Positives
- FN:
-
False Negatives
- TN:
-
True Negatives
- LR:
-
Logistic Regression
- NB:
-
Naive Bayes
- SVM:
-
Support Vector Machine
- ADT:
-
Adaboost Decision Tree
- CNN:
-
Convolutional Neural Network
- AE:
-
Autoencoder
References
Cheng M, Li L, Ren Y, Lou Y, Gao J. A hybrid method to extract clinical information from chinese electronic medical records. IEEE Access. 2019; 7:70624–33. https://doi.org/10.1109/ACCESS.2019.2919121.
Zhao C, Jiang J, Guan Y, Guo X, He B. Emr-based medical knowledge representation and inference via markov random fields and distributed representation learning. Artif Intell Med. 2018; 87:49–59. https://doi.org/10.1016/j.artmed.2018.03.005.
Pereboom M, Mulder IJ, Verweij SL, van der Hoeven RTM, Becker ML. A clinical decision support system to improve adequate dosing of gentamicin and vancomycin. I J Med Inform. 2019; 124:1–5. https://doi.org/10.1016/j.ijmedinf.2019.01.002.
Raita Y, Goto T, Faridi MK, Brown DFM, Camargo CA, Hasegawa K. Emergency department triage prediction of clinical outcomes using machine learning models. Crit Care. 2019; 23(1).
Matthew Clark. Prediction of clinical risks by analysis of preclinical and clinical adverse events. J Biomed Informa. 2015; 54(C):167–73.
Buchan K, Filannino M, Uzuner z. Automatic prediction of coronary artery disease from clinical narratives. J Biomed Inform. 2017; 72:23.
Yang CC, Veltri P. Intelligent healthcare informatics in big data era. Artif Intell Med. 2015; 65(2):75–7. https://doi.org/10.1016/j.artmed.2015.08.002.
Hu Y., Duan K., Zhang Y., Hossain M. S., Rahman S. M. M., Alelaiwi A.Simultaneously aided diagnosis model for outpatient departments via healthcare big data analytics. Multimedia Tools Appl. 2018; 77(3):3729–43. https://doi.org/10.1007/s11042-016-3719-1.
Yang Z, Huang Y, Jiang Y, Sun Y, Zhang Y, Luo P. Clinical assistant diagnosis for electronic medical record based on convolutional neural network. Sci Rep. 2018; 8:6329. https://doi.org/10.1038/s41598-018-24389-w.
Jabbar MA, Deekshatulu BL, Chandra P. Prediction of heart disease using random forest and feature subset selection. In: Innovations in Bio-Inspired Computing and Applications-Proceedings of the 6th International Conference on Innovations in Bio-Inspired Computing and Applications (IBICA 2015) Held in Kochi, India During December 16-18, 2015. Switzerland: Springer: 2015. p. 187–96. https://doi.org/10.1007/978-3-319-28031-8_16.
van der Geest PJ, Mohseni M, Linssen J, Duran S, de Jonge R, Groeneveld ABJ. The intensive care infection score – a novel marker for the prediction of infection and its severity. Crit Care. 2016; 20(1):1–8.
GERDES JS, POLIN RA. Sepsis screen in neonates with evaluation of plasma fibronectin. Pediatr Infect Dis J. 1987; 6(5):443.
Wang H, Zhang W, Zeng Q, Li Z, Feng K, Liu L. Extracting important information from chinese operation notes with natural language processing methods. J Biomed Informa. 2014; 48:130–6. https://doi.org/10.1016/j.jbi.2013.12.017.
Rink B, Harabagiu SM, Roberts K. Automatic extraction of relations between medical concepts in clinical texts. JAMIA. 2011; 18(5):594–600. https://doi.org/10.1136/amiajnl-2011-000153.
Hayakawa K, Mezaki K, Kobayakawa M, Yamamoto K, Ohmagari N. Impact of rapid identification of positive blood cultures using the verigene system on antibiotic prescriptions: A prospective study of community-onset bacteremia in a tertiary hospital in japan. Plos One. 2017; 12(7):0181548.
Lee JH, Kim YH. Predictive factors of true bacteremia and the clinical utility of blood cultures as a prognostic tool in patients with community-onset pneumonia. Medicine. 2016; 95(41):5058.
Matheny ME, FitzHenry F, Speroff T, Hathaway J, Murff HJ, Brown SH, Fielstein EM, Dittus RS, Elkin PL. Detection of blood culture bacterial contamination using natural language processing. In: AMIA 2009, American Medical Informatics Association Annual Symposium, November 14-18, 2009. San Francisco: AMIA: 2009.
Steenkiste TV, Ruyssinck J, Baets LD, Decruyenaere J, Turck FD, Ongenae F, Dhaene T. Accurate prediction of blood culture outcome in the intensive care unit using long short-term memory neural networks. Artif Intell Med. 2019; 97:38–43. https://doi.org/10.1016/j.artmed.2018.10.008.
Ren Y, Fei H, Liang X, Ji D, Cheng M. A hybrid neural network model for predicting kidney disease in hypertension patients based on electronic health records. BMC Med Inf Decis Making. 2019; 19-S(2):131–8. https://doi.org/10.1186/s12911-019-0765-4.
Flynt A, Daepp MIG. Diet-related chronic disease in the northeastern united states: a model-based clustering approach. Int J Health Geogr. 2015; 14(1):25.
Zou Q, Qu K, Luo Y, Yin D, Ju Y, Tang H. Predicting diabetes mellitus with machine learning techniques. Front Genet. 2018; 9:515.
Ding X, Li J, Liang H, Wang Z, Jiao T, Liu Z, Yi L, Bian W, Wang S, Xizhu, Sun T. Predictive model for acute respiratory distress syndrome events in ICU patients in china using machine learning algorithms: a secondary analysis of a cohort study. J Trans Med. 2019; 17:326.
Liu Y, Liu Y-H, Tan N, Chen J-Y, Zhou Y-L, Duan C-Y, Li H-L, Chen P-Y. Novel risk scoring for pre-procedural prediction of contrast-induced nephropathy and poor long-term outcomes among patients with chronic total occlusion undergoing percutaneous coronary intervention. Eur Heart J Suppl. 2015; 17(suppl C):34–41.
Ripoll VJR, Vellido A, Romero E, Ruiz-Rodríguez JC. Sepsis mortality prediction with the quotient basis kernel. Artif Intell Med. 2014; 61(1):45–52. https://doi.org/10.1016/j.artmed.2014.03.004.
Mani S, Ozdas A, Aliferis CF, Varol HA, Chen Q, Carnevale RJ, Chen Y, Romano-Keeler J, Nian H, Weitkamp J. Medical decision support using machine learning for early detection of late-onset neonatal sepsis. JAMIA. 2014; 21(2):326–36. https://doi.org/10.1136/amiajnl-2013-001854.
Lukaszewski RA, Yates AM, Jackson MC, Swingler K, Scherer JM, Simpson AJ, Sadler P, McQuillan P, Titball RW, Brooks TJG. Presymptomatic prediction of sepsis in intensive care unit patients. Clin Vaccine Immunol Cvi. 2008; 15(7):1089.
Khor R, Nguyen AN, O’Dwyer J, Kothari G, Sia J, Chang D, Ng SP, Duchesne G, Foroudi F. Extracting tumour prognostic factors from a diverse electronic record dataset in genito-urinary oncology. I J Med Informas. 2019; 121:53–7. https://doi.org/10.1016/j.ijmedinf.2018.10.008.
Hu D, Dong W, Lu X, Duan H, He K, Huang Z. Evidential MACE prediction of acute coronary syndrome using electronic health records. BMC Med Inf Decis Making. 2019; 19-S(2):9–17. https://doi.org/10.1186/s12911-019-0754-7.
Fan Z, Bi D, He L, Shiping M, Gao S, Li C. Low-level structure feature extraction for image processing via stacked sparse denoising autoencoder. Neurocomputing. 2017; 243(C):12–20.
Vincent P, Larochelle H, Bengio Y, Manzagol P. Extracting and composing robust features with denoising autoencoders. In: Machine Learning, Proceedings of the Twenty-Fifth International Conference (ICML 2008), June 5-9, 2008. Helsinki, Finland: ACM Press: 2008. p. 1096–103. https://doi.org/10.1145/1390156.1390294.
Ling W, Dyer C, Black AW, Trancoso I. Two/too simple adaptations of word2vec for syntax problems. In: Conference of the North American Chapter of the Association for Computational Linguistics – Human Language Technologies. Denver: The Association for Computational Linguistics: 2015. p. 1299–04. https://doi.org/10.3115/v1/n15-1142.
Chen R, Yang Y, Miao F, Cai Y, Li Y. 3-year risk prediction of coronary heart disease in hypertension patients: A preliminary study. In: International Conference of the IEEE Engineering in Medicine & Biology Society. Jeju Island: IEEE: 2017. p. 1182–85. https://doi.org/10.1109/embc.2017.8037041.
Acknowledgements
Not applicable.
About this supplement
This article has been published as part of BMC Medical Informatics and Decision Making Volume 20 Supplement 3, 2020: Health Information Processing. The full contents of the supplement are available online at https://bmcmedinformdecismak.biomedcentral.com/articles/supplements/volume-20-supplement-3.
Funding
This paper is partially supported by the following grants: the National Natural Science Foundation of China (Grant No. 61802350, No. 81701687), National Key Research and Development Program of China (No. 2019YFC0118803), the Ministry of Education of China Project of Humanities and Social Sciences (No.19YJCZH198), the Educational Commission of Henan (No. 17A520050), and the Henan Medical Science and Technology Research Project (No. 2018020087). Publication costs are funded by the National Natural Science Foundation of China (No. 61802350).
Author information
Authors and Affiliations
Contributions
The work presented here was carried out in collaboration between all authors. CM leaded the method design and participated in result analysis and paper revision. ZXL and DXF participated in data preprocessing, experiment design, result analysis. GJB participated in manuscript revision. XSF and RYF participated in method design, result analysis, and manuscript revision. All author(s) read and approved the final manuscript.
Corresponding authors
Ethics declarations
Ethics approval and consent to participate
Not applicable.
Consent for publication
Not applicable.
Competing interests
The authors declare that they have no competing interests.
Additional information
Publisher’s Note
Springer Nature remains neutral with regard to jurisdictional claims in published maps and institutional affiliations.
Rights and permissions
Open Access This article is licensed under a Creative Commons Attribution 4.0 International License, which permits use, sharing, adaptation, distribution and reproduction in any medium or format, as long as you give appropriate credit to the original author(s) and the source, provide a link to the Creative Commons licence, and indicate if changes were made. The images or other third party material in this article are included in the article’s Creative Commons licence, unless indicated otherwise in a credit line to the material. If material is not included in the article’s Creative Commons licence and your intended use is not permitted by statutory regulation or exceeds the permitted use, you will need to obtain permission directly from the copyright holder. To view a copy of this licence, visit http://creativecommons.org/licenses/by/4.0/. The Creative Commons Public Domain Dedication waiver (http://creativecommons.org/publicdomain/zero/1.0/) applies to the data made available in this article, unless otherwise stated in a credit line to the data.
About this article

Cite this article
Cheng, M., Zhao, X., Ding, X. et al. Prediction of blood culture outcome using hybrid neural network model based on electronic health records. BMC Med Inform Decis Mak 20 (Suppl 3), 121 (2020). https://doi.org/10.1186/s12911-020-1113-4
Published:
DOI: https://doi.org/10.1186/s12911-020-1113-4