- Research
- Open access
- Published:
Learning temporal weights of clinical events using variable importance
BMC Medical Informatics and Decision Making volume 16, Article number: 71 (2016)
Abstract
Background
Longitudinal data sources, such as electronic health records (EHRs), are very valuable for monitoring adverse drug events (ADEs). However, ADEs are heavily under-reported in EHRs. Using machine learning algorithms to automatically detect patients that should have had ADEs reported in their health records is an efficient and effective solution. One of the challenges to that end is how to take into account the temporality of clinical events, which are time stamped in EHRs, and providing these as features for machine learning algorithms to exploit. Previous research on this topic suggests that representing EHR data as a bag of temporally weighted clinical events is promising; however, the weights were in that case pre-assigned according to their time stamps, which is limited and potentially less accurate. This study therefore focuses on how to learn weights that effectively take into account the temporality and importance of clinical events for ADE detection.
Methods
Variable importance obtained from the random forest learning algorithm is used for extracting temporal weights. Two strategies are proposed for applying the learned weights: weighted aggregation and weighted sampling. The first strategy aggregates the weighted clinical events from different time windows to form new features; the second strategy retains the original features but samples them by using their weights as probabilities when building each tree in the forest. The predictive performance of random forest models using the learned weights with the two strategies is compared to using pre-assigned weights. In addition, to assess the sensitivity of the weight-learning procedure, weights from different granularity levels are evaluated and compared.
Results
In the weighted sampling strategy, using learned weights significantly improves the predictive performance, in comparison to using pre-assigned weights; however, there is no significant difference between them in the weighted aggregation strategy. Moreover, the granularity of the weight learning procedure has a significant impact on the former, but not on the latter.
Conclusions
Learning temporal weights is significantly beneficial in terms of predictive performance with the weighted sampling strategy. Moreover, weighted aggregation generally diminishes the impact of temporal weighting of the clinical events, irrespective of whether the weights are pre-assigned or learned.
Background
Adverse drug events (ADEs) have become a major public health problem by causing approximately 2.4 to 12.0 percent of hospital admissions worldwide [1–3]. To improve drug safety, a wide range of data sources have been used [4], among which electronic health records (EHRs) are an especially valuable source of information [5, 6]. It is not only because EHR data provides a holistic perspective of patients’ health history, including diagnoses, drug admissions, laboratory tests and so on; they also contain longitudinal data over a long time period across a large population. Nevertheless, ADEs are still under-reported in EHRs [7]. Manually screening millions of health records to identify ADEs is practically impossible for the massive amounts of data archived in an EHR database. To mitigate this problem, supervised machine learning can be adopted to automatically detect the presence of an ADE in health records in which it was not but should have been reported [8–14]. To that end, predictive models are trained to detect health records that contain ADEs with clinical events – i.e., diagnoses, drugs, clinical measurements, etc. – as features. These clinical events are reported in a chronological order in EHRs and the same event often appears in the same health record several times at different time points.
One of the advantages of using longitudinal data, such as EHRs, is that clinical events are recorded chronologically. As a result, temporality can be included as a parameter when building predictive models from this data, which is especially important for tasks like identifying ADEs. There have been attempts to handle the temporality of clinical events when fitting machine learning models to EHR data. Examples include Singh et al. [15] using EHRs to predict kidney function loss and Zhao et al. [16] identifying ADEs in EHR data. The former proposed the Stacked-Temporal strategy that divides patients’ medical history into a number of time windows and then merges the clinical events within each time window; this was likewise, but independently, proposed in the latter study, in which the strategy was denoted Bag of Binned Events. The disadvantage of this strategy is that the dimensionality of the feature increases almost proportionally with the number of time windows. Singh et al. [15] proposed an additional strategy to handle temporality, called Multitask-Temporal, that creates a predictive model using clinical events from each time window and aggregates the outcomes from each task. Meanwhile, Zhao et al. [16] proposed a strategy, called Bag of Weighted Events, that assigns weights to clinical events from different time windows and then aggregates the weighted events. Both studies use aggregation of clinical events at different time points and compare their strategy to a baseline which does not take temporality into account, and both have shown improved predictive performance when incorporating temporal information in the medical history of patients. However, in the Multitask-Temporal strategy, the predictive task is divided into a set of parallel tasks focusing on each time window, and, consequently, models the relationship between the target event, in their case kidney function loss, and clinical events from different time windows independently. Tackling tasks like ADE detection requires the ability to take into account all events from the medical history of patients since an ADE could be the result of a combination of clinical events at different time points. This is especially true for chronic or dose-dependent ADEs. Therefore, the Bag of Weighted Events strategy is advantageous in that it assigns temporal weights to clinical events from different time windows accordingly, and hence it not only takes into account the whole medical history but also incorporates the temporality of clinical events in the predictive models.
As a continuation of the Bag of Weighted Events strategy, another study [17] explored and evaluates various weighting strategies based on the temporality of clinical events in EHRs. Those strategies, however, obtain weights according to each clinical event’s time stamp in relation to the target event; hence each clinical event receives a weight that is calculated globally in the same way as the others, regardless of differences in terms of informativeness. For example, body temperature that is measured one day before the target event, diagnosis of hypotension, receives a higher weight compared to blood pressure from three days ago, even if the latter is considered more important in the model for predicting drug induced hypotension. Therefore, it is natural not only to weight a clinical event based on its temporality, but also, to take into account its importance in predicting the target event. This study aims to enable learning weights locally for each clinical event at each time point and evaluate their impact on the performance of predictive models for ADE detection in EHRs.
Methods
Here, we first introduce the concept of temporal weighting from previous research; we then describe how such weights can be learned automatically. Once the temporal weights are obtained, two strategies for applying them in the predictive modeling procedure are presented. To evaluate their impact on predictive performance, a series of experiments are designed using random forest as the supervised machine learning algorithm. The experiments are conducted on 19 datasets, each one corresponding to a specific ADE, that are extracted from the Stockholm EPR Corpus, a Swedish EHR database. For each patient, a health record of 90 days before the target ADE is analyzed. To assess the predictive performance of random forest models using different temporal weighting strategies, accuracy, area under ROC curve (AUC) and area under the precision and recall curve (AUPRC) are used. Finally, the granularity of the weight learning procedure is explored in order to gain more evidence on the sensitivity of the weights learning scheme.
Temporal weighting strategies
Temporal weighting of clinical events aims to assign a weight to each event that takes into account the temporality of this event. The assigned weight will be used to build predictive models that exploit the corresponding clinical event as a feature. In the previous study [17], a temporal weighting strategy follows such a form: for a clinical event that occurred n days prior to the occurrence of an ADE, weight w is assigned according to a curve function f(n). Nine different temporal weighting strategies were proposed in that study, all of which follow the common underlying assumption: events that occur closer to the target ADE are more important, in terms of their informativeness in the predictive models, and should hence receive more weight than those that occurred a longer time before the target ADE. Therefore, events that occurred in the same day as the target ADE receive a weight of 1, the highest weight; the weight then decreases monotonically with the number of days between the corresponding event and the target ADE until 90 days. Ninety days was chosen arbitrarily with common sense, i.e., the drugs or other clinical events that occurred more than 3 months before the occurrence of an ADE were considered unlikely to make significant contribution. All assigned weights are between 0 and 1. It was observed in that study that the impact of applying different temporal weighting strategies is significant; among the proposed strategies, the best predictive performance is obtained from assigning weights according to a reciprocal function of n, as follows:
Learning weights automatically
Learning weights automatically is, in this study, performed with the assumption that more informative clinical events should receive higher weights, in contrast to the pre-assigned weights where more recent clinical events receive higher weights. Estimation of the informativeness of clinical events with different time stamps can, naturally, be achieved by treating each clinical event from a particular time window as a separate feature, i.e., the Bag of Binned Events strategy in [16].
Here, we divide 90 days of the patient medical history before the target ADE event into 12 time windows, which are 1, 2, 3, 4, 5, 6, 7, 14, 21, 30, 60, 90 days before the target ADE event, excluding events from the previous time window. Therefore, the same clinical events from different time windows are treated as different features. Weights learning is then achieved by building predictive models using features from all 12 time windows and extracting weights in accordance with the informativeness of the features. In this study, this is done by calculating variable importance with the random forest algorithm [18], the variable importance is estimated using Gini score, which tests the impurity of each feature as a splitting node in the tree. The details of the random forest algorithm and variable importance is described later in Experimental Setup.
Once the weights of the clinical events have been obtained, the question moves on to how one can make use of them when building the predictive model. Here, we explore and evaluate the following two strategies for applying the learned temporal weights, which, together with the learning weights scheme, are illustrated in Fig. 1.
-
Weighted Aggregation – corresponding weights are applied to the value of each event from different time windows and then the weighted values of the same event are aggregated.
Fig. 1 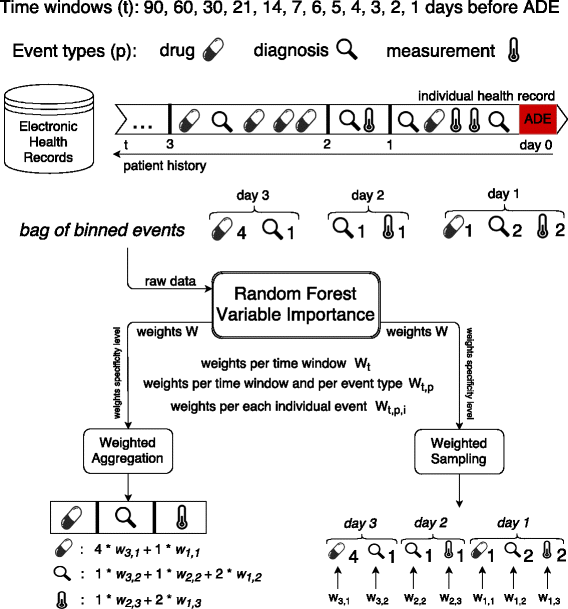
Learning temporal weights of clinical events from electronic health records
-
Weighted Sampling – weights are used as probabilities with which features are sampled to be considered as possible splitting nodes in the random forest algorithm.

The first strategy is a natural extension of previous studies [16, 17], while the second strategy is inspired by previous work on enriched random forest [19]. Although the random forest algorithm has been proven to be robust, especially in handling high dimensional data, predictive performance of the traditional random forest algorithm seems to degrade when working on high dimensional data but with a low proportion of truly informative features [19]. Such a situation typically occurs in gene expression data and longitudinal healthcare data. Here, for example, we extract all of the clinical events in the medical history of patients and use them as features describing each patient; however, it is not hard to imagine that a patient could have visited the hospital for various reasons, not all of which is related to the target ADE. In this case, among the large number of clinical events, only a small portion of them might be informative for predicting the target ADE. When the proportion of such non-informative features is large, it is almost certain that each tree in the forest would be built on at least one non-informative feature. Thus the average quality of each tree declines, and consequently results in a less robust forest. This method has been shown to be better than pre-filtering out the non-informative features on genome expression data [19]. Normally, features have an equal chance to be selected when building each tree in the forest; here, more important features have a higher chance to be selected. In this case, we use the learned weight for each feature as the probability of it being selected. Doing so allows us to avoid aggregating features from different time windows and to model their importance accordingly. It also allows us to take into account possible interactions between the same event from different time windows (see Algorithm 1).

Granularity of weight learning
The temporal weights learned from the above scheme are specific for each individual event from each time window. To obtain insights into this scheme, in terms of sensitivity, i.e., how the predictive model’s performance would be influenced if the learned weights were from a different level of specificity, we also explored the granularity of the weight learning. More specifically, we would like to understand whether the impact of temporality varies only with the temporal information or if it is also influenced by the event types and even particular events of the same type. Here, three levels of specificity of weight learning were investigated:
-
Per time window: a unique weight is learnt for all events in the same time window.
-
Per event type in each time window: a unique weight is learnt for each event type (i.e., diagnosis, drug and clinical measurement) in the same time window.
-
Per individual event: a unique weight is learnt for each individual event from each event type in each time window.
Data source
In this study, 19 datasets were extracted from a real EHR system – the Stockholm EPR Corpus [20]. This research has been approved by the Regional Ethical Review Board in Stockholm (permission number 2012/834-31/5). This database contains health records from about 1.2 million patients over 7 years (2009–2015), which were collected from Karolinska University Hospital in Stockholm, Sweden. This database consists of heterogeneous types of information, including 11,623 unique diagnoses (encoded by ICD-10, the 10th revision of the International Statistical Classification of Diseases and Related Health Problems), 1,564 unique drugs (encoded by ATC, Anatomical Therapeutic Chemical Classification System), 1,877 unique clinical measurements from laboratory tests and millions of clinical notes in free-text. Here, we focus on the use of structured information, i.e., diagnoses, drugs and clinical measurements.
A previous study [21] has categorized ICD-10 diagnosis codes in terms of how they are used for indicating ADEs during hospital admissions, among which category A.1 (a drug-related causation was noted in the diagnosis code) and category A.2 (a drug- or other substance-related causation was noted in the diagnosis code) indicate a clear sign of ADE occurrence; hence the most frequent, at least assigned to 50 patients, A.1 and A.2 ADE-related diagnosis codes in the Stockholm EPR Corpus were selected. In total, 19 datasets were extracted with the existence of an ADE-related diagnosis code as the class label in each dataset. The task here is to detect patients who should, but do not, have a specific ADE reported in their health records, which results in a binary classification task.
In each dataset, positive examples are patients whom have been assigned an ADE-specific diagnosis code and negative examples are patients whom have been assigned a similar code (defined as two codes sharing the same first three levels of the ICD-10 concept hierarchy) to the corresponding ADE-related one. For instance, if the positive examples are patients diagnosed with I95.2 (Drug-induced hypotension), the negative examples are patients diagnosed with any code starting with I95 (Hypotension), but not I95.2. Features are formed from clinical events including diagnoses, drugs and clinical measurements, that occurred 90 days before the occurrence of the target ADE. According to the findings from an earlier study on representing clinical events in EHRs [8], for each example, the value for each clinical event (feature) was the total number of times that it occurred during the whole or a part of the patient history up to 90 days. The class label, the number of positive and negative examples and the number of clinical events involved in each dataset are described in Table 1.
Experimental setup
A series of experiments were conducted to evaluate the impact of learning weights of clinical events for predicting ADEs. First, we evaluated the predictive models using the learned temporal weights from the two proposed strategies, in comparison to using the pre-assigned weights, calculated as in Eq. 1.
In a follow-up experiment, in order to investigate how the learned weights influence the predictive performance in terms of tree quality and diversity, the average tree performance was compared to the ensemble performance, which provides some insight into the ensemble classifiers. In an ensemble model, such as random forest used in this study, there are two components that affect the predictive performance: the performance of each individual model (tree in the case of random forest) and to what extent the models vary in their predictions (often referred to as diversity [22]). In a regression framework, it is suggested that diversity can be estimated as the difference between the (squared) error of the ensemble and the average (squared) error of the ensemble members [23]. The above states that the ensemble error can be no higher than the average model error, and the more diversity, the lower the ensemble error. Currently, there is no standard for how to estimate diversity in a classification framework; here we adopt the idea from the regression framework, estimating the diversity as the difference between average tree performance and the ensemble performance in terms of error rate.
Finally, we explored the granularity of the weight learning by assigning weights on three specificity levels: (1) each individual clinical event in each time window receives a unique weight, denoted as all; (2) clinical events that belong to one event type in each time window receive a common weight, denoted as type; (3) all clinical events in each time window receive a common weight, denoted as time.
The random forest algorithm [18] was exploited in all experiments to generate predictive models. Random forest was chosen mainly for its reputation of being robust in terms of achieving high accuracy, its ability to handle high-dimensional data efficiently, as well as the possibility of obtaining estimates of variable importance. This algorithm is an ensemble classifier, which constructs a set of decision trees together voting for what class label to assign to an example to be classified. Each tree in the forest is built from a bootstrap replicate of the original instances, and a subset of all features is randomly sampled at each node when building the tree, in both cases to increase diversity among the trees. With increasing number of trees in the forest, the probability that a majority of trees makes an error decreases, given that the trees perform better than random and that the errors are made independently. The algorithm has often been shown in practice to result in state-of-the-art predictive performance, though this condition can only be guaranteed in theory. In this study, each random forest consisted of 500 trees. Another advantage of the random forest algorithm is that it produces variable importance, which can be estimated in different ways, see, e.g., [18]. In this study, Gini importance [24] was used as the variable importance metric, where a high Gini importance indicates that a variable plays a greater role in splitting the data into the defined classes. A Gini importance of zero means that a variable is considered useless or is never selected to build any tree in the forest.
The generated predictive models were evaluated via stratified 5-fold cross validation with 2 iterations. Performance evaluation metrics were accuracy, area under the ROC curve (AUC) and area under the precision-recall curve (AUPRC). Accuracy measures the percentage of correct predictions including both positive and negative ones. A ROC curve represents the relation between sensitivity (recall) and specificity, where the former measures how many of the positive examples have been identified as being positive and the latter measures how many of the negative examples have been identified as being negative. AUC depicts the performance of a model without regard to class distribution or error costs by estimating the probability that a model ranks a randomly chosen positive example ahead of a negative one. Both sensitivity and specificity are irrespective of the actual positive/negative balance on the test set; therefore, AUC is not biased in the case of a skewed class distribution. Finally, AUPRC represents the relation between precision and recall, depicting the probability that precision is higher than recall for each recall threshold. Since, precision measures how many of the examples been identified as being positive are true positive, and hence this score depends on how rare is the positive class. Therefore, AUPRC is preferred when the positive class is rare but of greater interest than the negative class.
When two models were compared to each other, the Wilcoxon signed-rank test was used to assess the statistical significance; when there were more than two models being compared, the Friedman test [25] was employed for statistical testing of the null hypothesis that all models perform equally, followed by a post-hoc test using the Bergmann-Hommel procedure [26] to conduct significance tests on pair-wise comparisons.
Results
In this study, the scheme of learning temporal weights of clinical events, including two ways of applying the learned weights, i.e., Weighted Aggregation and Weighted Sampling, was evaluated. The former aggregates the same clinical event from different time windows in accordance to the learned weights, while the latter exploits the learned weights as sampling probabilities of the clinical events when constructing each tree in the random forest. In both strategies, the use of learned weights is compared to the use of pre-assigned weights for each clinical event based on its time stamp in relation to the target ADE, i.e., the number of days between the two events, respectively. Table 2 lists the results of comparing the predictive performance of the Weighted Aggregation strategy by applying pre-assigned and learned weights on 19 datasets extracted from an EHR database. It is shown that there is no significant difference on the impact of pre-assigning weights or learning weights. Nevertheless, from Table 3, where the corresponding results of the Weighted Sampling strategy are presented, we can see that by learning the temporal weights of clinical events, the predictive performance is significantly improved on all selected performance metrics. Especially for accuracy and AUPRC, performance is enhanced by about 5 % overall and for some datasets, such as D611, D695 and O355, the improvement is over 10 % on accuracy.
In order to understand why the learned weights in the weighted sampling leads to significant improved performance compared to the pre-assigned weights, we compared the average tree performance and the ensemble (forest) performance for each of them. Figure 2 shows the error rates of average tree and ensemble of all the proposed weighting strategies in this study. It is obvious that using learned weights in the weighted sampling (LWS) leads to the strongest trees and consequently the best ensemble, given its lowest error rate. Moreover, if we compare the difference between the average tree performance and the ensemble performance for each of the weighting strategies, both strategies using learned weights yield bigger differences than using pre-assigned weights. It is interesting to note that, in the weighted aggregation strategy, the ensemble performance when using preassigned weights (PWS) is comparable to using learned weights (LWA), even if the average tree quality is higher in the former.

Error rates of average tree versus ensemble of the weighted aggregation (WA) and weighted sampling (WS) strategy using pre-assigned (P) and learned (L) weights respectively
In the last experiment, we investigated the impact of the granularity of temporal weights learning, where three specificity levels were evaluated: (1) weights learned on a time-window level; (2) weights learned on an event-type level within each time window; and (3) weights learned on an individual level from each event type within each time window. Comparing the predictive performance of models exploiting weights from these three specificity levels in Fig. 3, we can see that the choice of specificity level has a significant impact on the predictive performance in the Weighted Sampling strategy, but no such significance is observed in the Weighted Aggregation strategy.

Compare weights learned on different specificity levels in terms of predictive performance. Green indicates a significant difference and red indicates no significance. P-values are obtained via a Friedman test
The post-hoc analysis through the Bergmann-Hommel procedure, as shown in Table 4, indicates that, overall, learning weights on each individual clinical event level (all) yields better performance compared to the other two more general levels; learning weights on each individual clinical event level (all) leads to significantly improved accuracy and AUPRC compared to learning weights per event type from each time window (type); the difference between learning weights per event type and per time window is almost negligible.
Discussion
This study evaluated the impact of learning temporal weights of clinical events, which was applied through two strategies, weighted aggregation and weighted sampling, in electronic health records for adverse drug event detection. The evaluation was done by exploiting these strategies to generate features on 19 datasets extracted from an EHR database. The results show that in the weighted sampling strategy, using learned weights significantly improves the predictive performance compared to using pre-assigned weights; however, there is no significant difference between them in the weighted aggregation strategy. One explanation for the latter could be the high sparsity of the data. All of the 19 datasets in this study are of high dimensionality and sparsity due to the fact that most clinical events only occurred to a small group of patients, i.e., the vast majority of the examples for a given feature have a value of zero. For features with only one or very few non-zero values, the impact of applying different weighting strategies is almost negligible, even though some of these features might be valuable indicators. To be more specific, if a feature has only one or a few non-zero values, when using it as an indicator to classify the examples, it does not matter whether these small numbers of non-zero values are weighted or not since they will most likely be distinguished against all the zero values; as a result, the applied weights will have almost no impact on the predictive performance. In the weighted aggregation strategy, the learned weights were embedded in the feature values, which does not affect the sparsity; therefore, for very sparse features, no matter how their weights change, their contribution to the predictive performance will not be influenced. However, in the weighted sampling strategy, the learned weights were used as sampling probabilities, which makes use of the higher weighted, i.e., more informative, features more often, so that the weights have a higher and more direct impact on the predictive performance.
Besides the difference between the learned weights and the pre-assigned weights within each strategy, the weighted sampling strategy only leads to better predictive performance than the weighted aggregation strategy when using learned weights, i.e., the choice of strategy on applying the weights matters less with the pre-assigned weights (given the close results between PWA and PWS). This indicates that the improved predictive performance is a result of the combination of learning weights and application of the weighted sampling strategy. To understand more deeply how the performance is improved, we looked into the random forest models in terms of average tree quality and diversity. The results in Fig. 2 indicates that using learned weights in the weighted sampling strategy yields the best predictive performance due both to better individual tree quality and larger diversity. Moreover, learning weights also contributes to bigger diversity in the weighted aggregation strategy. Comparing learning weights in both the weighted aggregation (LWA) and weighted sampling (LWS) strategy, it seems that the latter does not result in a lower diversity as one would have expected, given that, there, the important features appear in many trees. It is probably due to the high dimensionality of all the datasets and, more importantly, an indication that a really small portion of features are relevant/important; hence, even though this small number of important features appear in many trees, the diversity is still maintained by the other features that are selected to build each tree. Therefore, weighted sampling using learned weights is particularly beneficial when using vast amounts of clinical events from EHRs for predictive modelling, where probably only a small amount of information is highly relevant to the predicting target, while the remaining information is less useful.
Another advantage of learning weights, besides taking into account the importance of each clinical event, is that weights can be learned on a more specific level: rather than just looking at the time window, the specificity can be adjusted. Concerning the granularity of weights, pre-assigning weights is equivalent to learning weights per time window (denoted as time in Fig. 3 and Table 4), both of which assign the same weight to all clinical events from the same time window. Here, within a time window, different weights can be learned further for each event type (denoted as type) – i.e., diagnosis, drug and clinical measurement – or even each individual clinical event within each event type (denoted as all). Again, the impact of using weights from different specificity levels yields a significant impact only in the weighted sampling strategy, but not in the weighted aggregation strategy. It is probably a result of the high dimensionality and sparsity of the data as argued above. By looking at the post-hoc analysis results for the pairwise comparisons, we can see that, on one hand, learning weights for each event type gives the worst performance, which suggests that there is no evidence for treating different event types differently; on the other hand, learning weights for each individual clinical event, the most specific level, yields the best performance, which indicates that individual events should not be treated in the same way. For instance, diagnoses in general shouldn’t be more or less important than drugs; however, a particular diagnosis code can be more important than a particular drug. It is interesting to note that it is not that more specific weights learning gives better performance, as one would expect. Weights on the type level are more specific than the ones on the time level, but the latter sometimes outperforms the former.
One limitation of this study is that only one learning weights algorithm, namely random forest’s variable importance, is explored. In future work, other methods are worth investigating; for example, methods that do not use feedback from a classifier to assign weights but use a pre-existing model instead, such as information gain. Further along this line, learning weights here focuses on temporality and informativeness of the clinical events; nevertheless, there are also other criteria that can be used to learn the weights. For example, clinical events are represented as the number of times that they occur in a time window, which disallows learning weights based on event values and/or how sharply an event value changes over time. This is especially crucial when using clinical measurements as features.
Conclusion
The temporal information that is embedded in longitudinal healthcare data is very valuable for building predictive models for pharmacovigilance. Electronic health records is one of this kind, where clinical events, such as diagnoses, drug administrations and clinical measurements, are typically time stamped. Using pre-assigned weights according to events’ time stamps has been shown to be an effective way of exploiting temporality in predictive models. However, pre-assigned weights are limited to the chronology of clinical events, but fails to take into account their importance, in terms of informativeness, when building the predictive models. To mitigate this problem, this study focuses on how to learn the weights automatically when constructing the predictive models in a way that reflects both temporality and importance of the clinical events. To take into account the temporality, each patient’s medical history is segmented into a set of time windows and features are extracted from each of them; for the importance, a random forest model is built using these extracted features to produce variable importance, which is then used as the weight for each feature. To apply these weights, two strategies are proposed: weighted aggregation and weighted sampling. The former aggregates the weighted clinical events from different time windows to form new features, while the latter keeps the original features but samples them with their weights as probabilities when building each tree in the forest. We conclude here that learning weights is significantly beneficial in terms of predictive performance in the weighted sampling strategy. Moreover, weighted aggregation generally diminishes the impact of temporal weighting of the clinical events, irrespective of whether the weights are pre-assigned or learned.
References
Schneeweiss S, Hasford J, Göttler M, Hoffmann A, Riethling AK, Avorn J. Admissions caused by adverse drug events to internal medicine and emergency departments in hospitals: a longitudinal population-based study. Eur J Clin Pharmacol. 2002; 58(4):285–91.
Pirmohamed M, James S, Meakin S, Green C, Scott AK, Walley TJ, Farrar K, Park BK, Breckenridge AM. Adverse drug reactions as cause of admission to hospital: prospective analysis of 18 820 patients. BMJ. 2004; 329(7456):15–19.
Mjörndal T, Boman MD, Hägg S, Bäckström M, Wiholm BE, Wahlin A, Dahlqvist R. Adverse drug reactions as a cause for admissions to a department of internal medicine. Pharmacoepidemiol Drug Saf. 2002; 11(1):65–72.
Härmark L, Van Grootheest A. Pharmacovigilance: methods, recent developments and future perspectives. Eur J Clin Pharmacol. 2008; 64(8):743–52.
Schuemie MJ, Coloma PM, Straatman H, Herings RM, Trifirò G, Matthews JN, Prieto-Merino D, Molokhia M, Pedersen L, Gini R, et al. Using electronic health care records for drug safety signal detection: a comparative evaluation of statistical methods. Med Care. 2012; 50(10):890–7.
Harpaz R, Haerian K, Chase HS, Friedman C. Mining electronic health records for adverse drug effects using regression based methods. In: 1st ACM International Health Informatics Symposium. ACM: 2010. p. 100–7.
Hazell L, Shakir SA. Under-reporting of adverse drug reactions. Drug Saf. 2006; 29(5):385–96.
Zhao J, Henriksson A, Asker L, Boström H. Detecting adverse drug events with multiple representations of clinical measurements. In: IEEE International Conference on Bioinformatics and Biomedicine. IEEE: 2014. p. 536–43.
Zhao J, Henriksson A, Boström H. Detecting adverse drug events using concept hierarchies of clinical codes. In: IEEE International Conference on Healthcare Informatics. IEEE: 2014. p. 285–93.
Henriksson A, Zhao J, Boström H, Dalianis H. Modeling heterogeneous clinical sequence data in semantic space for adverse drug event detection. In: IEEE International Conference on Data Science and Advanced Analytics. IEEE: 2015.
Zhao J, Henriksson A, Boström H. Cascading adverse drug event detection in electronic health records. In: IEEE International Conference on Data Science and Advanced Analytics. IEEE: 2015.
Henriksson A, Kvist M, Dalianis H, Duneld M. Identifying adverse drug event information in clinical notes with distributional semantic representations of context. J Biomed Inform. 2015; 57:333–49.
Henriksson A. Representing clinical notes for adverse drug event detection. In: 6th International Workshop on Health Text Mining and Information Analysis (LOUHI). Association for Computational Linguistics: 2015. p. 152–8.
Henriksson A, Zhao J, Boström H, Dalianis H. Modeling electronic health records in ensembles of semantic spaces for adverse drug event detection. In: IEEE International Conference on Bioinformatics and Biomedicine. IEEE: 2015.
Singh A, Nadkarni G, Gottesman O, Ellis SB, Bottinger EP, Guttag JV. Incorporating temporal ehr data in predictive models for risk stratification of renal function deterioration. J Biomed Inform. 2015; 53:220–8.
Zhao J, Henriksson A, Kvist M, Asker L, Boström H. Handling temporality of clinical events for drug safety surveillance. In: American Medical Informatics Association (AMIA) Annual Symposium. American Medical Informatics Association: 2015.
Zhao J. Temporal weighting of clinical events in electronic health records for pharmacovigilance. In: IEEE International Conference on Bioinformatics and Biomedicine (BIBM). IEEE: 2015. p. 375–81.
Breiman L. Random forests. Mach Learn. 2001; 45(1):5–32.
Amaratunga D, Cabrera J, Lee YS. Enriched random forests. Bioinformatics. 2008; 24(18):2010–014.
Dalianis H, Hassel M, Henriksson A, Skeppstedt M. Stockholm epr corpus: a clinical database used to improve health care. In: Swedish Language Technology Conference: 2012.
Stausberg J, Hasford J. Drug-related admissions and hospital-acquired adverse drug events in germany: a longitudinal analysis from 2003 to 2007 of icd-10-coded routine data. BMC Health Serv Res. 2011; 11(1):134.
Kuncheva LI, Whitaker CJ. Measures of diversity in classifier ensembles and their relationship with the ensemble accuracy. Mach Learn. 2003; 51(2):181–207.
Krogh A, Vedelsby J. Neural network ensembles, cross validation, and cctive learning. In: Advances in Neural Information Processing Systems. Cambridge MA: MIT Press: 1995. p. 231–8.
Strobl C, Boulesteix AL, Zeileis A, Hothorn T. Bias in random forest variable importance measures: Illustrations, sources and a solution. BMC Bioinforma. 2007; 8(1):25.
Demšar J. Statistical comparisons of classifiers over multiple data sets. J Mach Learn Res. 2006; 7:1–30.
Garcia S, Herrera F. An extension on “statistical comparisons of classifiers over multiple data sets” for all pairwise comparisons. J Mach Learn Res. 2008; 9(12):2677–94.
Acknowledgements
This work was partly supported by the project High-Performance Data Mining for Drug Effect Detection at Stockholm University, funded by Swedish Foundation for Strategic Research under grant IIS11-0053.
Declarations
Publication costs for this article were funded by the project High-Performance Data Mining for Drug Effect Detection at Stockholm University. This article has been published as part of BMC Medical Informatics and Decision Making Vol 16 Suppl 2 2016: Selected articles from the IEEE International Conference on Bioinformatics and Biomedicine 2015: medical informatics and decision making. The full contents of the supplement are available online at http://bmcmedinformdecismak.biomedcentral.com/articles/supplements/volume-16-supplement-2.
Authors’ contributions
JZ initiated the idea of this study. JZ and AH participated in discussions on the study design. JZ and AH conducted the experiments. JZ created a draft of the manuscript. AH commented on the draft. Both authors read and approved the final manuscript.
Competing interests
The authors declare that they have no competing interests.
Author information
Authors and Affiliations
Corresponding author
Rights and permissions
Open Access This article is distributed under the terms of the Creative Commons Attribution 4.0 International License (http://creativecommons.org/licenses/by/4.0/), which permits unrestricted use, distribution, and reproduction in any medium, provided you give appropriate credit to the original author(s) and the source, provide a link to the Creative Commons license, and indicate if changes were made. The Creative Commons Public Domain Dedication waiver (http://creativecommons.org/publicdomain/zero/1.0/) applies to the data made available in this article, unless otherwise stated.
About this article

Cite this article
Zhao, J., Henriksson, A. Learning temporal weights of clinical events using variable importance. BMC Med Inform Decis Mak 16 (Suppl 2), 71 (2016). https://doi.org/10.1186/s12911-016-0311-6
Published:
DOI: https://doi.org/10.1186/s12911-016-0311-6